


If you have scrolled through the housing news lately, you have probably seen a version of the same story: more sellers than buyers, prices flattening, homes taking longer to sell. The numbers behind those headlines are real. But they describe the whole country, not your neighborhood, and sometimes not even your county.
Here is what the national data actually showed in September 2026, according to Redfin: an estimated 62.6% more sellers than buyers nationwide, U.S. median sale prices up 1.3% year over year, and a median of 51 days on market. Closer to home, Redfin estimates 18.5% more sellers than buyers in the Cleveland metro. If you live here, you might read that and wonder whether to wait on selling or hold off on buying.
My advice: look at your market first. National figures are estimates built from a broad mix of housing across the entire country, and the Cleveland metro extends well beyond the five counties my team and I work in every day. Neither one tells you what is happening on your street.
So let us look at what the local MLS reports actually show for single-family homes in Q3 2026, compared with Q3 2025:
- Western Cuyahoga, our 17 service-area communities: median sale price up approximately 2.9%; median 12 days on market.
- Lorain County: up 0.7%; 21 days.
- Erie County: down 1.4%; 37 days.
- Huron County: down 2.2%; 36 days.
- Ottawa County: up 18.7%; 50 days.
A few things stand out. Among single-family homes that closed in Q3 2026, median days on market was 12. Lorain held steady with a modest gain. Erie and Huron saw median prices pull back, though homes there actually spent fewer days on market than they did in Q3 2025. And Ottawa's large jump in median price likely reflects the mix of properties sold this quarter, so I would not read it as 18.7% appreciation for every home.
The key point: a median price change describes the middle of what sold, not the value of any one home. Your situation depends on your community, your price point, and the timing and condition of your sale. That is why we sit down with buyers and sellers in Avon, Avon Lake, and Lorain, and across all five counties, and walk through their specific numbers. National headlines are good for context. Local data is good for decisions.
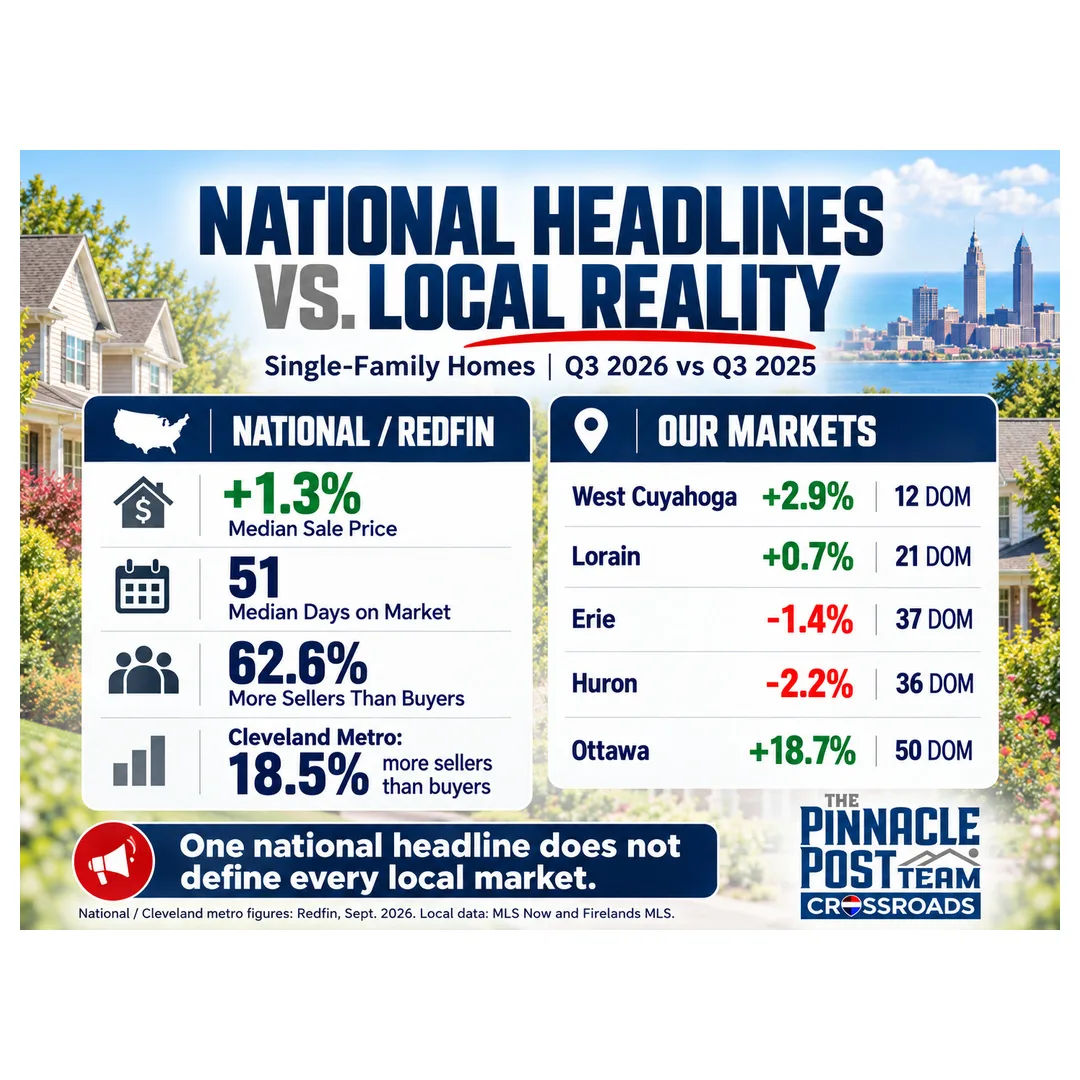
Median single-family sale price change and days on market by county, Q3 2026 vs. Q3 2025
Want to know what the numbers say about your neighborhood? Reach out to The Pinnacle Post Team and we will pull the recent sales in your community and walk you through what they mean for your plans. You can see the full footprint of where we work on our service areas page.
Schedule a Free 15-Minute Local Market Conversation
No pressure, no obligation. Just your market, in plain English.
Book My 15-Minute ConversationThis is part one of a three-part series. Part 2, the Seller Edition, and Part 3, the Buyer Edition, dig into what the local numbers mean for your plans.
A Note on the Data
- Redfin's seller-versus-buyer figures are estimates, not the exact ratio from our local MLS reports.
- The Cleveland metro includes areas outside our service area.
- National figures reflect September 2026 and a broader mix of housing; local figures are Q3 2026 versus Q3 2025 and single-family homes only.
- Median sale-price changes do not represent appreciation of any individual home.
- One incorrect Western Cuyahoga MLS sale price has been identified and verified; the exact median effect is being confirmed before the approximately +2.9% figure is described as fully corrected.
- Ottawa County's large median-price increase may reflect changes in the mix of properties sold and should not be presented as typical appreciation for every home.
Sources
- Redfin, "Buyers vs. Sellers" study and U.S. housing market data, September 2026
- MLS Now and Firelands MLS, Q3 2025 and Q3 2026 reports